Miscellaneous Examples
Doug Kelkhoff
2022-06-28 05:19:11
miscellaneous-examples.Rmd##
## Attaching package: 'dplyr'## The following objects are masked from 'package:stats':
##
## filter, lag## The following objects are masked from 'package:base':
##
## intersect, setdiff, setequal, unionDot Matrix Plots
ggpk_dot_matrix <- function(..., width = 10) {
  ggpacket(...) %+%
  geom_point(
    data = . %>% mutate(
      xvar = (1:nrow(.)-1) %%  width,
      yvar = (1:nrow(.)-1) %/% width),
    mapping = aes(x = xvar, y = yvar),
    ...) %+%
  theme_void() %+%
  coord_fixed()
}
diamonds %>%
  sample_frac(0.01) %>%
  arrange(cut) %>%

  ggplot() +
    aes(color = cut) +
    ggpk_dot_matrix(size = 3, width = 30)
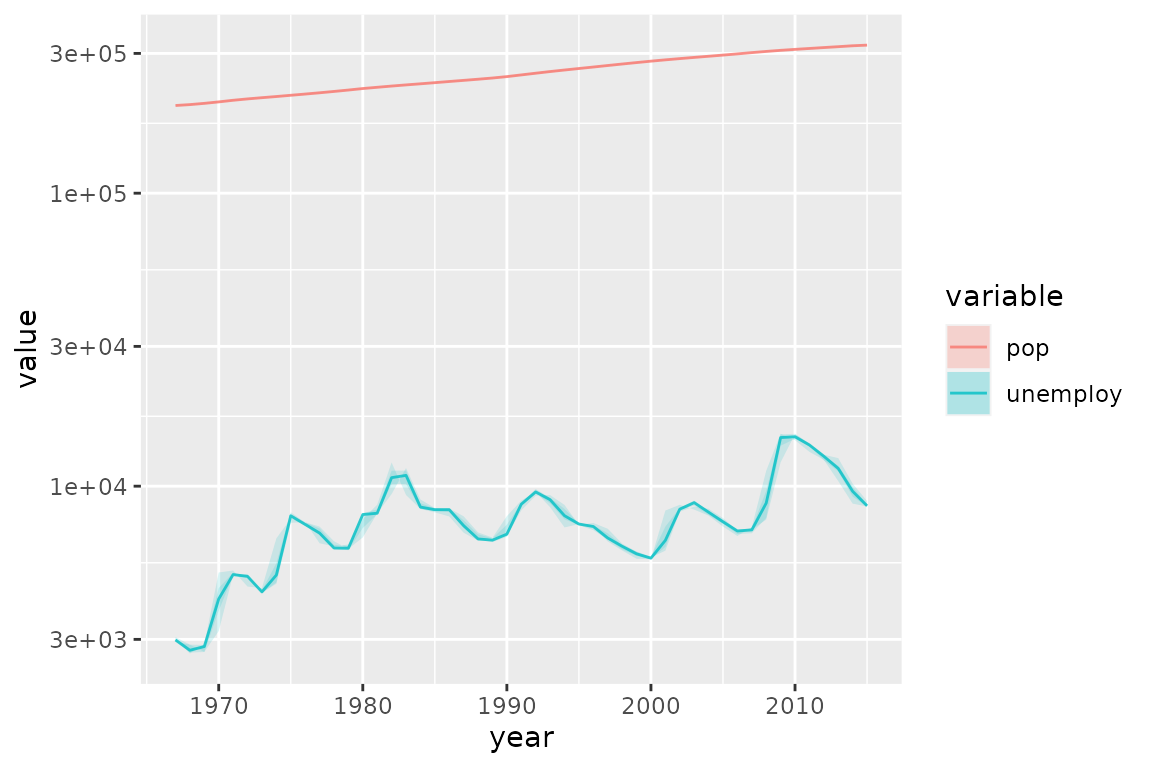
Tukey Ribbons
ggpk_tukey_ribbons <- function(...) {
  ggpacket(...) %+%

  # Tukey Box Edges
  geom_ribbon(.id = "box",
    mapping = aes(fill = ..color..),
    stat = 'summary',
    fun = median,
    fun.min = ~quantile(., 0.25, names = FALSE),
    fun.max = ~quantile(., 0.75, names = FALSE),
    alpha = 0.15,
    ...,
    color = NA) %+%

  # Tukey Whiskers
  geom_ribbon(.id = "whisker",
    mapping = aes(fill = ..color..),
    stat = 'summary',
    fun = median,
    fun.min = ~.[head(which(. > quantile(., 0.25, names = FALSE) - 1.5 * IQR(.)), 1)],
    fun.max = ~.[tail(which(. < quantile(., 0.75, names = FALSE) + 1.5 * IQR(.)), 1)],
    alpha = 0.15,
    ...,
    color = NA) %+%

  # Median Line
  geom_line(.id = list(NULL, 'line'),
    stat = 'summary',
    fun = median,
    alpha = 0.8,
    ...)
}
economics_long %>%
  filter(variable %in% c('pop', 'unemploy')) %>%
  mutate(year = as.integer(format(as.Date(date, format="%Y-%m-%d"),"%Y"))) %>%

  ggplot() + aes(x = year, y = value, color = variable) +
    ggpk_tukey_ribbons() +
    scale_y_log10()