ggpackets: Package Plot Layers for Easier Portability and Modularization
ggpackets-package.RdCreate groups of ggplot layers that can be easily migrated from one plot to another, reducing redundant code and improving the ability to format many plots that draw from the same source ggpacket layers.
Author
Maintainer: Doug Kelkhoff doug.kelkhoff@gmail.com
Examples
# Prep a tidy data.frame to plot with
airquality_long <- rbind(
data.frame(
airquality[,c("Month", "Day")],
Variable = "Temp",
Measurement = airquality$Temp),
data.frame(
airquality[,c("Month", "Day")],
Variable = "Ozone",
Measurement = airquality$Ozone))
# Build our new composite ggplot geom
geom_error_line <- ggpacket() %+%
geom_ribbon(
.id = "box",
mapping = aes(fill = ..color..),
stat = 'summary',
fun = mean,
fun.min = ~mean(.) - sd(.),
fun.max = ~mean(.) + sd(.),
alpha = 0.15,
color = NA) %+%
geom_line(
.id = "line",
stat = 'summary',
fun = mean,
alpha = 0.8)
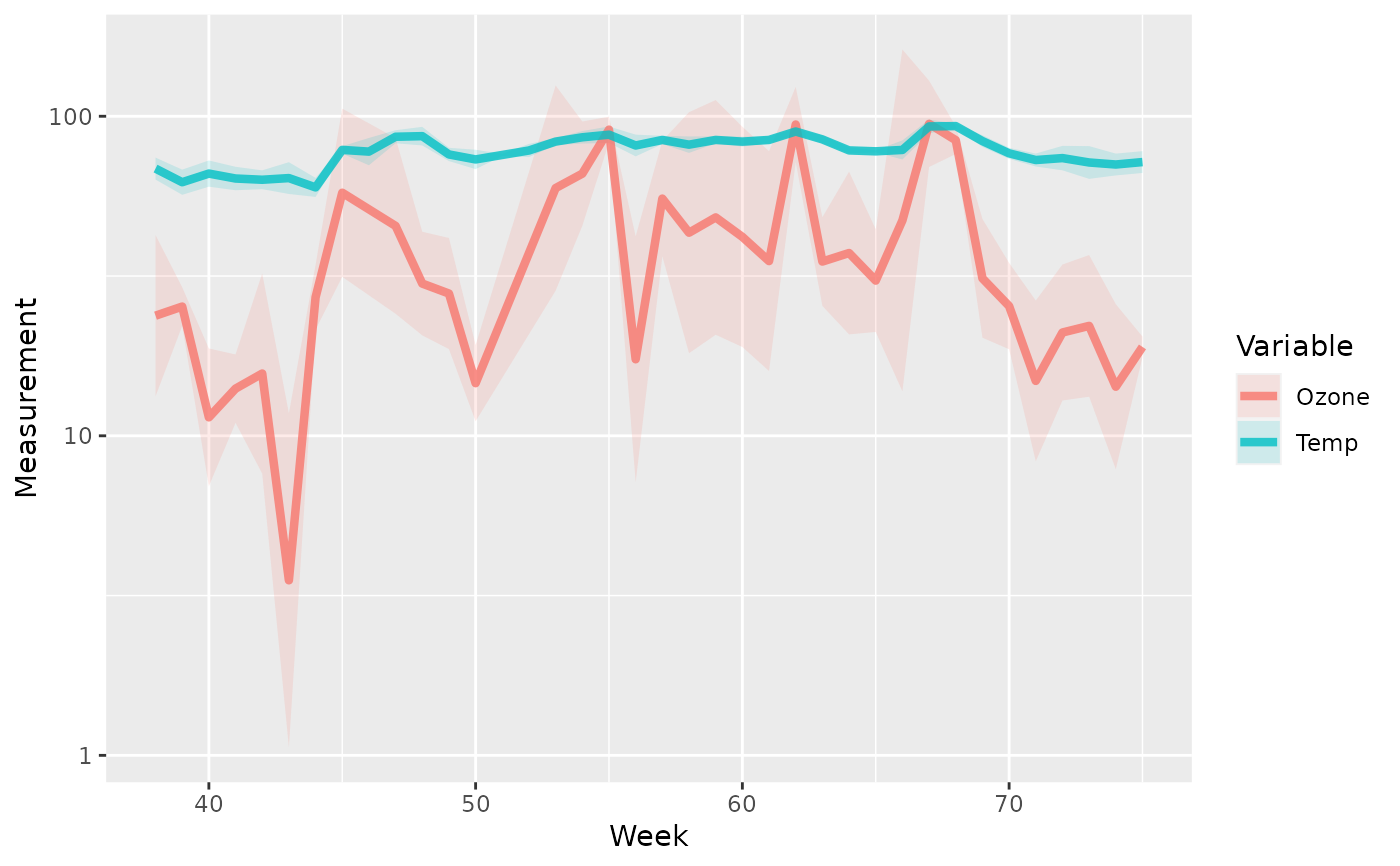
# Try it out!
ggplot(airquality_long) +
aes(x = round((Month * 30 + Day) / 4), y = Measurement, color = Variable) +
geom_error_line(na.rm = TRUE, line.size = 1.5) +
scale_y_log10() +
labs(x = "Week")
 # for further examples, check out the vignettes
vignette(package = "ggpackets")
#> no vignettes found
# for further examples, check out the vignettes
vignette(package = "ggpackets")
#> no vignettes found